This website uses cookies so that we can provide you with the best user experience possible. Cookie information is stored in your browser and performs functions such as recognising you when you return to our website and helping our team to understand which sections of the website you find most interesting and useful.
Dashboard Gallery
Go head-to-head with Power BI, Tableau & Cognos
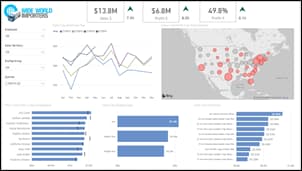
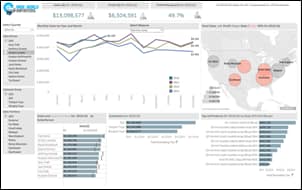
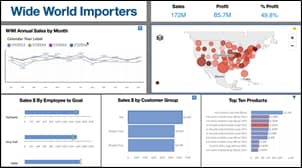
A single data set. Three dashboards to let you compare. Use the links below to interact, assess and do a head-to-head comparison of Power BI, Tableau and Cognos.
Want to get a better idea of how the three stack up to each other? View our on-demand webinar where we compare these tools.
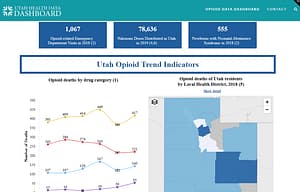
State of Utah opioid data
We developed this dashboard for the state of Utah to provide actionable data related to the opioid epidemic. The dashboard provides an overview of the most current data for opioid-related indicators and compares them with data from previous time periods to inform opioid overdose prevention efforts.
IBM Cognos Analytics


