The Microsoft business intelligence (BI) landscape is wide, overlapping and ever-changing. Over the past three decades, Microsoft released a bevy of analytics technologies, and that pace has only increased since Power BI was released in 2015.
We first created this comparison chart in 2020 to help address client questions about “what does what in the Microsoft analytics ecosystem?” With the release of Microsoft Fabric in 2023, we’ve been fielding more of these questions than ever. It was time to update the chart! Our refreshed comparison includes 69 Microsoft data and analytics technologies, including Fabric.
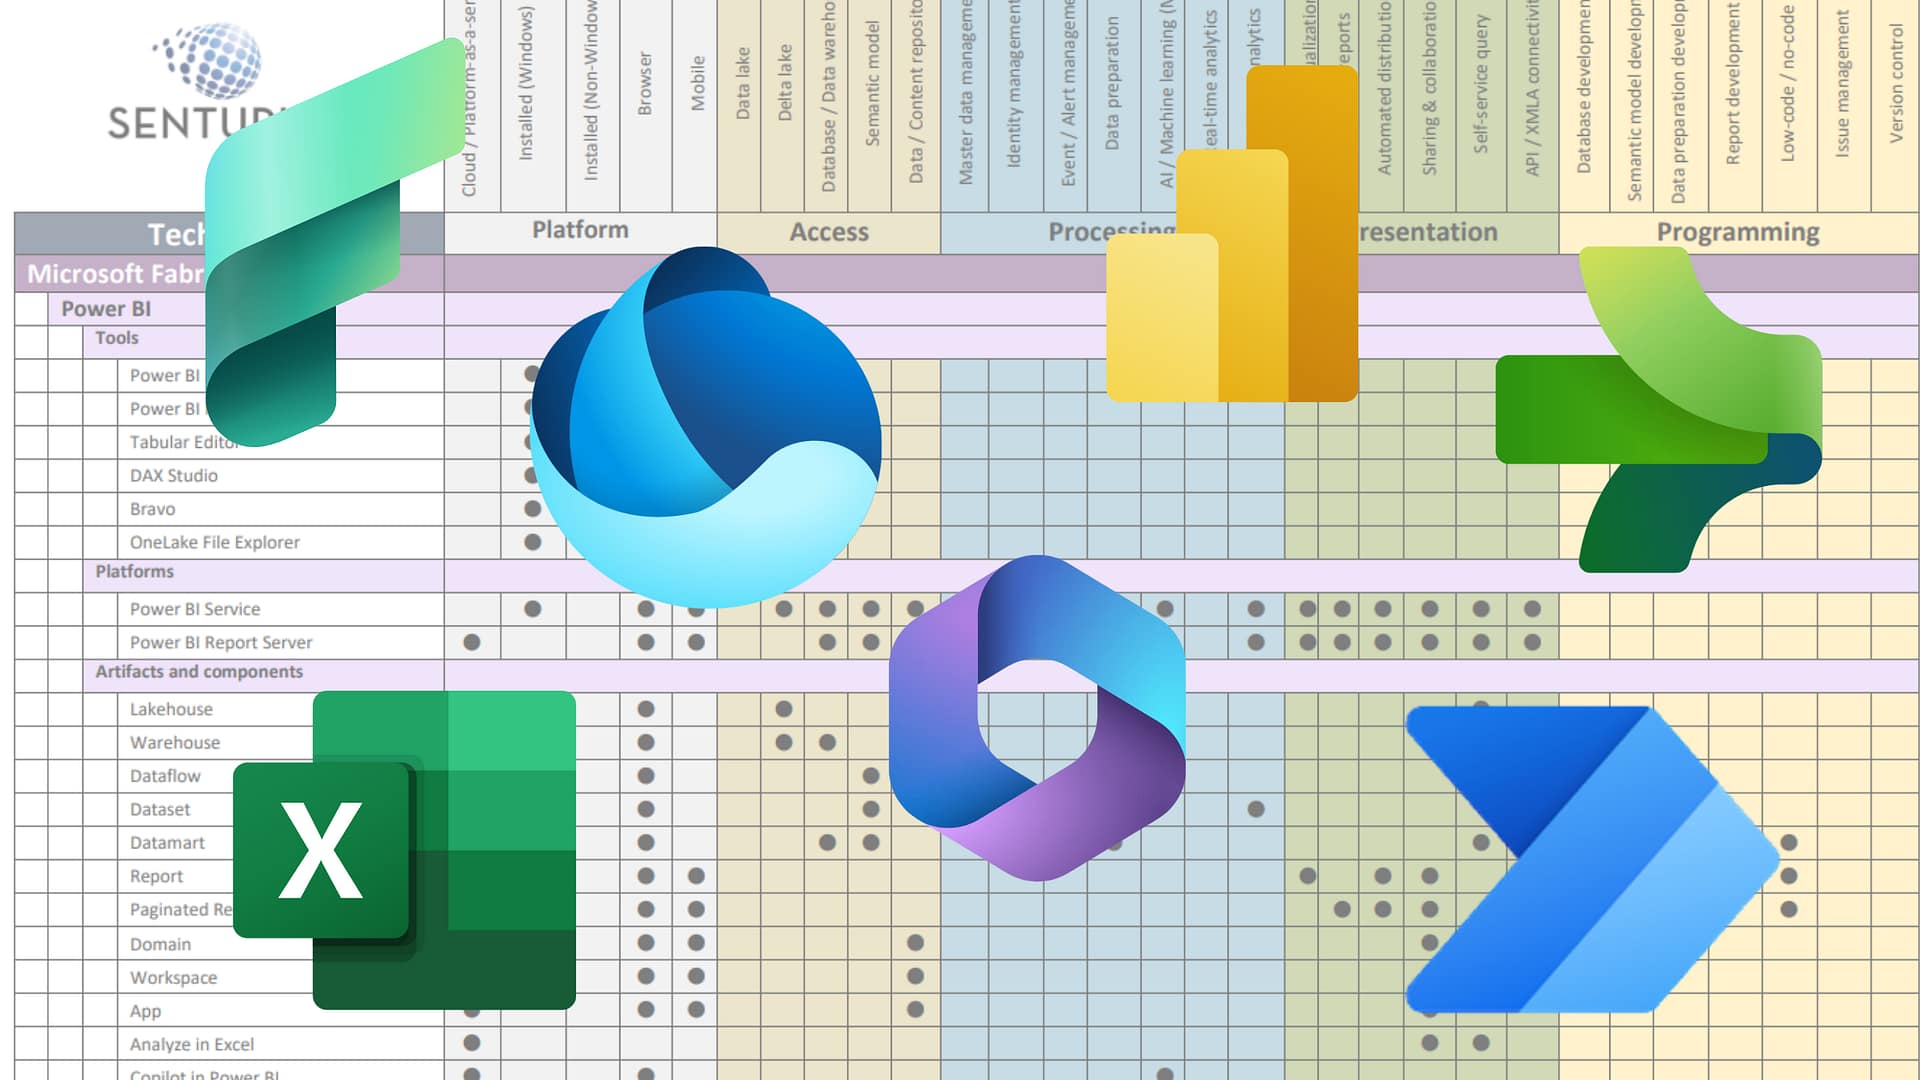
This easy-to-read, chart compares the most business-critical functions across all relevant technologies in the Microsoft analytics stack.
Get at-a-glance guidance to questions like:
- What can we expect Power BI Desktop to do (or not do)?
- How is SharePoint part of the Microsoft BI story?
- Which technologies provide AI capabilities?
Richly detailed, this comparison chart is an excellent wayfinder for navigating functionalities to determine the appropriate Microsoft solution for your analytics and data needs.
Technologies are organized as follows:
- Microsoft Fabric
-
- Power BI Tools
-
-
- Platforms
- Artifacts and components
-
-
- Other (e.g., Data Warehouse, Data Activator)
- Power Platform
- Azure / Cloud
-
- Database / semantic model
- Storage
-
- Processing
- DevOps
- SQL Server
-
- Components
-
- Tools
- Microsoft 365 (Office)
Functions are organized into five categories:
- Platform. How do I get to this technology?
Examples: Is it a cloud resource? Can it be installed locally? Does a non-Windows version exist? - Access. What kind of data repository is this technology?
Examples: Is it a database? Data lake? Content store? - Processing. How does this technology alter data?
Examples: Does it perform integrations? Can it send alerts? Does it have AI or machine learning capabilities? - Presentation. How does this technology present information?
Examples: Does it have interactive reports? Does it provide self-service querying? Does it facilitate sharing and collaboration? - Programming. How might a developer expect to interact with this technology?
Examples: Can it be used to perform database development? Report development? Version control?