For many TM1 solutions, developers often face the design question of how to implement time elements. Continuous time or discrete time? One dimension or two dimensions?
A single, continuous time dimension where elements span multiple years generally provides better performance, simpler rule/calculation definitions and cross-year reporting and visualizations. However, other reporting and analytical requirements are better served with two dimensions: one with the year elements and a second with generic time periods.
With the new hierarchy features in IBM Planning Analytics 2.0, continuous and discrete time capabilities can be delivered with a single time dimension.
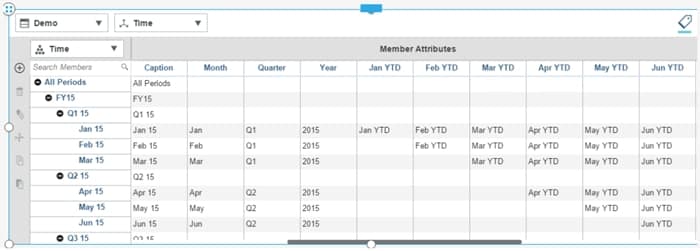
In the example below, the time dimension is designed as continuous, spanning four years, but discrete time elements (Month, Quarter, Year, YTD) can be defined and populated as attributes.
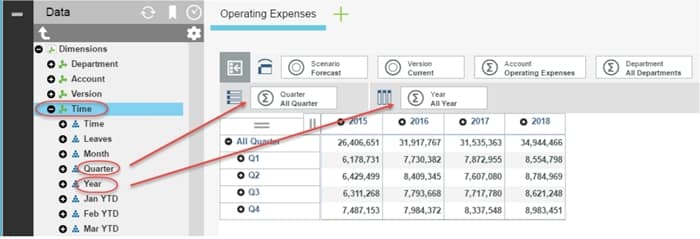
In the latest release, a hierarchy can be created from each attribute with each behaving as virtual dimension. Each hierarchy is listed underneath the dimension. The screenshot below shows how the Quarter hierarchy and Year hierarchy can be positioned on different axes to achieve discrete time capabilities.
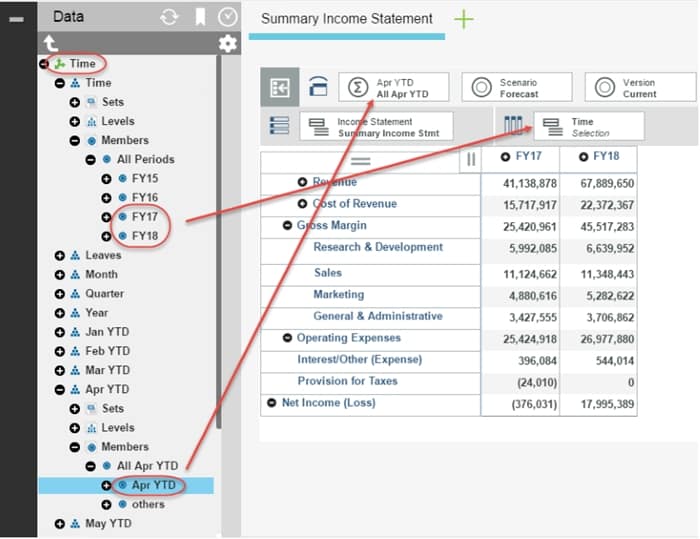
The following example illustrates how hierarchies can be used for year-to-date reporting. The YTD hierarchy can be used to filter the months, and then year elements can be placed in the column position for side-by-side comparisons.
The hierarchy features of IBM Planning Analytics 2.0 simplify the model design and development process while delivering greater analytical capabilities.
Thanks to our own Ken O’Boyle for this post. Our primary TM1 trainer, Ken has more than 20 years of hands-on experience architecting, implementing and delivering training for enterprise planning, business intelligence and data warehousing solutions.


