Power BI offers many ways to pull in data for analysis. But what approach should your organization take? The answer depends on considerations that include whether or not your organization has an existing data warehouse, your need for real-time dashboarding and the ease-of-use factor for your analysts. We explore four options, outlining the pros and cons of each.
Consolidate data in a data warehouse
Many enterprises centralize their operational data in a data warehouse (DW). A DW is ideal for structured data that can then be dimensionally modeled to create analysis-ready data. A correctly modeled DW will enable faster analysis and be recognized as the “single source of truth” for the organization. Row-level security can be layered on top of the DW, data catalogs can be used to describe the model and audit logs can be tracked from these DW products. Some common product examples include Microsoft Analysis Services, Amazon Redshift and Snowflake.
Getting structured data into a DW is typically referred to as Extract, Transform, Load (ETL). This logically named process involves extracting data from operational systems, transforming and cleaning the data, then loading the data into the DW storage. Calculations created in the DW produce high-quality data that the business uses for day-to-day monitoring and analysis. The downside is the time it takes to set up and model the ETL routines.
Some data storage sources support live queries from the DW to the data store. With this capability, the DW is a modeling and security layer, but queries still execute on the underlying database. This can mean always fresh data, but you also risk impacting live operational system performance. Data warehouses are also capable of caching and preprocessing data to lessen that operational impact and improve query performance.
Connecting Power BI to SQL Server Analysis Services, Redshift or Snowflake
Power BI can connect to various data warehouse products. To do so, click Get Data → Database, then select your product.
If you’re running multiple systems or combining a spreadsheet with your DW data, the modeling view in Power BI will let you combine the data by creating relationships between different the data sources.
Pros: IT can maintain a single source of truth with a well-structured, analysis-ready data warehouse. Products exist that can enhance less structured data so that it can be queried. Some products cover both structured and unstructured data, which can help reduce the number of complex systems to maintain. A wide variety of BI tools can leverage the same single source of truth.
Cons: The process of creating new ETL routines and modeling data appropriately is typically time consuming. Models tend to be custom to each organization. Organizations typically generate new types of data faster than it can be added to the DW.
Best for: Organizations that already have an established DW and a data focused team devoted to maintaining, securing and improving it.
DirectQuery to data connections
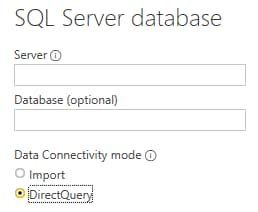
If your organization does not have a data warehouse set up, users can connect directly to several operational system databases for the information they need. Live queries will be run against the data source using the DirectQuery data connectivity mode.
While the data will always be current, there are many concerns that arise from this approach. The BI tool may trigger large queries that impact performance of both the operational system and the BI tool. The numbers on a report may change during analysis as the data in the operational system changes. Upgrading the operational systems may break BI reports if the database schema changes.
The modeling view in Power BI will automatically detect relationships defined at the database level. Calculated columns, data formatting and measures can also be built into the dataset during modeling, but with limitations. The query that results from the Get Data dialog or Query Editor will be used in a sub-select within the queries generated and dispatched to retrieve the necessary data for a visualization. As a result, the query defined within Query Editor must be valid within this context and features like Common Table Expressions and Stored Procedures are not available.
When publishing a report, the dataset is also published to Power BI service. That published dataset can then be used to create other reports without the need to re-model data. Setting up a Power BI Gateway machine will be needed to allow DirectQuery to on-premise data sources from Power BI service.
Pros: Data is always fresh. Start creating reports from source data quickly without waiting for someone else to create an ETL process.
Cons: Performance can be slow or can hinder operational systems. Upgrading operational systems can break BI reports when data schemas change. The setup of web-based data sources can be complex for a business analyst user, typically involving developer level authentication methods and heavy data transformation. Data transformations that can be applied with Query Editor are limited.
Best for: Quickly building dashboards that need real-time data for a reasonable number of users.
Data imports from data connections
The next approach is for data to be extracted from an operational system, then imported into Power BI. There are two main ways this can happen:
- The operational system has data exports that a user runs manually. The resulting structured text files (CSV, JSON, XML) can be manually imported into Power BI using a file data connection. This process remains manual and is primarily useful for one-off, ad-hoc analysis.
- The operational system database or online service API can be connected to by a user with access. When setting up the connection, the user selects the Import data connectivity mode. After the report is published to Power BI service, the data import can be refreshed on a schedule. For on-premise data sources, configuring Power BI Gateway will be necessary.
This approach minimizes the impact to the operational system as the export can be performed or scheduled during times of low activity. The manual export is labor intensive and not ideal for often-repeated analysis. After imported, reports will usually perform quickly as network traffic and/or operational system performance are no longer factors.
Like DirectQuery datasets, the modeling view in Power BI will automatically detect relationships defined at the database level. Calculated columns, data formatting and measures can also be built into the dataset during modeling. When publishing a report, the dataset is also published to Power BI service. That published dataset can then be used to create other reports without the need to re-model data.
Pros: Performance is improved after data is imported. Operational systems are not inadvertently impacted.
Cons: Power BI datasets can currently only be used by Power BI products. There is a 1GB data size limit when publishing a dataset using a Power BI Pro account or 10GB if the workspace is assigned to Power BI Premium capacity (with potentially larger limiting coming soon). The setup of web-based data sources can be complex for a business analyst user. Initial data imports may take a very long time for large datasets. Duplicating data in an imported dataset can create additional storage, security and administration tasks.
Best for: Quickly building dashboards that can display recent, but not live data quickly to many users.
Dataflows
Dataflows work like the DW approach, but instead use a managed Azure Data Lake for storage and map data to a pre-defined data schema to unlock insights more quickly.
Using Power Query Online, users can build data flows from the Power BI service using drag and drop, UI-driven tools that enable self-service data prep. First, a connection to the data source is made. Then the data columns are mapped to elements of a Common Data Model object.
Dataflows are designed to use the Common Data Model (CDM), a standardized, modular, extensible collection of data schemas published by Microsoft. The driving idea is to have one global definition of an object like “Customer” or “Order” so that generic apps, custom apps and even machine learning models can understand the data quickly. The idea here is the same as with a DW containing the single source of truth for your company, but with an expanded definition so that people new to your business or outside your business can understand your data quickly. The CDM can be expanded with additional objects and attributes to capture data points that are more specific to your organization.
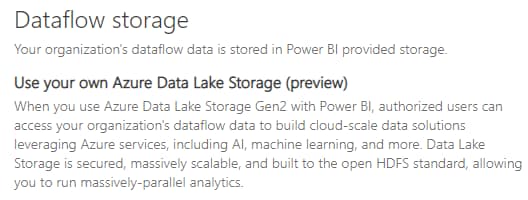
Dataflows pull data into a fully managed Azure Data Lake. By default, this data lake isn’t directly accessible to Power BI users and no additional administration is necessary. However, the Admin portal provides an option to connect to an existing Azure Data Lake if you already use that resource, perhaps with centrally managed ETL tools like Azure Data Factory instead of Power Query Online. Dataflows can pull data from on-premise data sources using Power BI Gateway.
A Power BI Pro user license is required for creating and managing dataflows, as they are built in Power BI service. An organization-level Premium license adds additional storage space, more daily data refreshes, in-storage computations and the ability to perform an incremental refresh to minimize impact on your resources.
Pros: Business users can pull data into a central data store. Data can be mapped to widely used and well-thought-out data models and stored in simple, fully managed data lakes.
Cons: Organizations with unique data models may find the CDM mapping process and customization cumbersome. The product is still maturing with capabilities like row-level security and DirectQuery not fully baked in.
Best for: When a DW doesn’t already exist and many different data sources need to be consolidated for reusable reporting, analysis and even machine learning purposes.
Bottom line
Your insights are only as good as the quality of the data you are working with. As you can see, the methods we describe for bringing data into Power BI each carry considerations that not only affect aspects of security and performance, but can also impact data integrity.
If you need more guidance in determining the best way to connect, model and manage data for your organization or want to address performance, security and scalability in Power BI, don’t hesitate to contact us. Having well organized data is the first, and most critical, step to ensuring nimble, reliable and highly performant BI that drives meaningful, timely decisions and new sources of revenue.


