Organizations have many disparate data sources that can yield up meaningful insights when using visualization tools like Power BI. But first, that data needs to be combined and organized into a format that matches the decision-making needs of the business. And to achieve the scalability required of modern BI and a truly data-driven culture, the data needs to be delivered automatically, reliably and in a timely fashion.
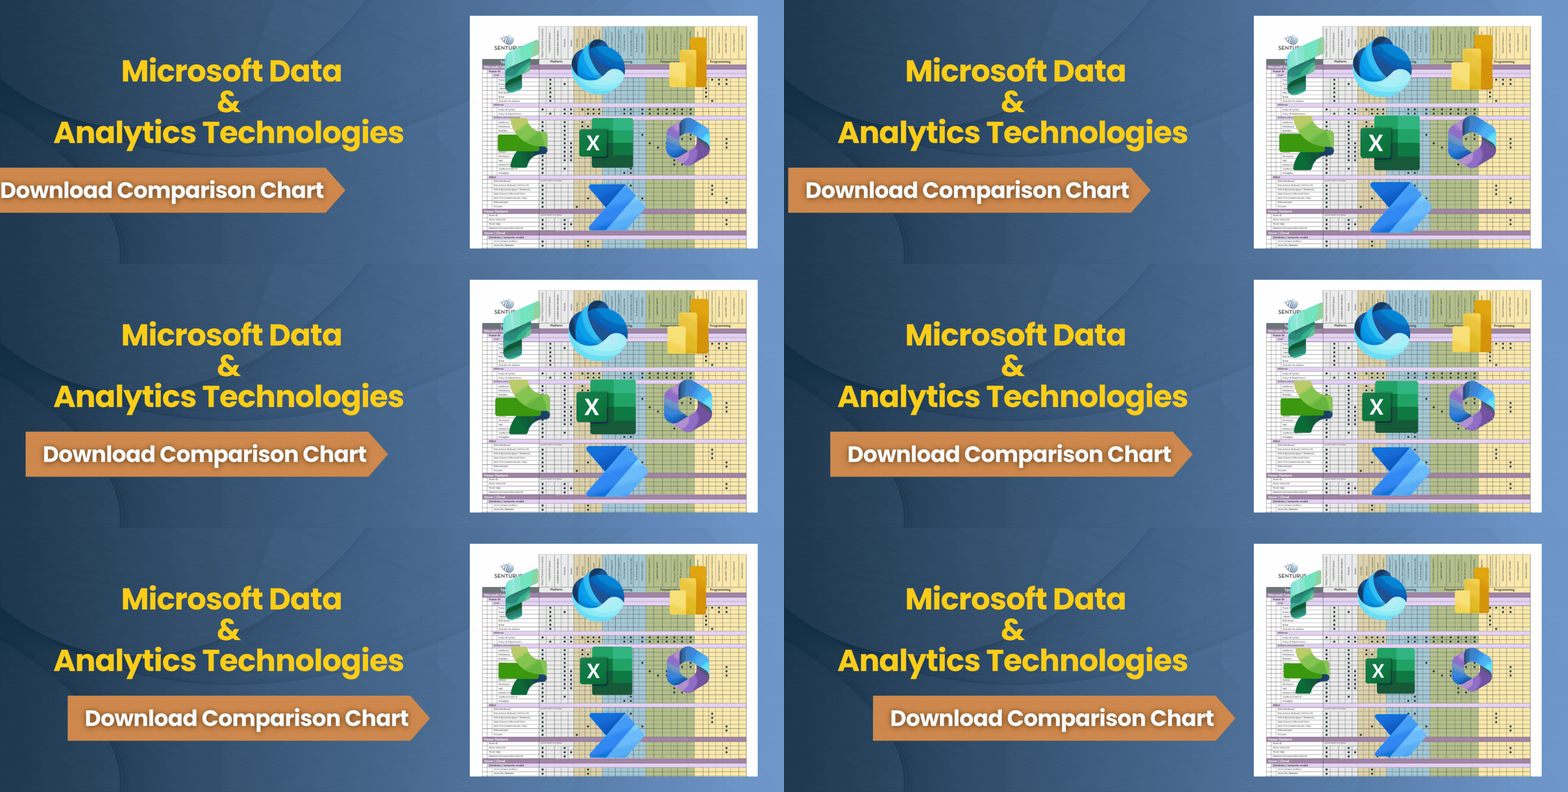
The Microsoft BI platform offers a broad array of technologies for data integration and preparation. The challenge, however, is determining which one of them is the right tool for the job at hand. We created this chart to compare the capabilities of five Microsoft data modeling and transformation tools.
As a companion to this chart, our on-demand webinar goes into more depth on the features of each tool and demos
- Mapping data flows in Azure Data Factory
- Real-time Power BI dashboards using Azure Stream Analytics
In the chart, we summarize the cost, ease of use, cloud/on-prem, product maturity, feature set, supported visualization tools, use cases and available support of
- Power Query
- Power BI Dataflows
- Integration Services (SSIS)
- Azure Stream Analytics
- Azure Data Factory
Multiple considerations come into play when determining the best tool including Microsoft’s product roadmap, your organization’s existing analytics platform(s) and cloud strategy, the source data being integrated, performance, scope and scalability, security, data refresh frequency and more.
Navigating all the options and knowing where to optimize the platform can be tricky. If you’d like help with any aspect of your Microsoft/Power BI environment – whether it’s around data transformations, report distribution options, system performance concerns or reducing cost of ownership around Premium capacity—we can help. Contact us.


