Excel (with Power Query, PowerPivot, Power View)
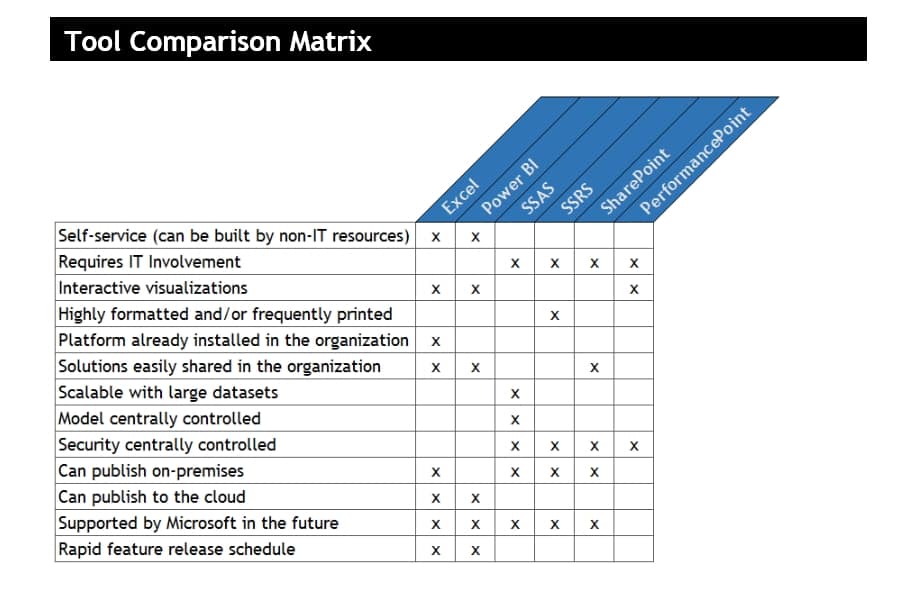
Excel is a spreadsheet application that has been enhanced with various add-ins over time to become a business intelligence sandbox. Power Query allows designers to pull data from a variety of sources and transform it as necessary. PowerPivot is a data model in which data sources can be loaded into various tables, which can can then be given relationships and measures can be defined on that framework. Power View is a visualization tool that facilitates graphical presentation of the data model via charts, graphs and a host of other visualizations.
Power BI
Power BI is a suite of business analytics tools used to analyze data and share insights. Much like Excel with its various add-ins, Power BI Desktop is a one-stop shop for data preparation, modeling and visualization. In addition to modeling data internally, Power BI can present data from external data sources hosted in databases such as Analysis Services. These datasets and reports can be published to a cloud-based portal called the Power BI service, and report components can be pinned to dashboards and easily shared with colleagues. Power BI is on a rapid-release schedule with new updates released every month.
Reporting services
SQL Server Reporting Services (SSRS) is a framework in which static and parameterized reports can be authored, published to a server-based portal and consumed online by a defined audience. A report is comprised of any combination of data grids, charts, graphs and other visualizations. These reports are built to be predictable, accurate, reliable, stable, printable and “pixel-perfect:” every component is exactly where it should be on the page. In the future, SSRS will be the on-premises hosting solution for many report types, including Power BI.
Analysis services
SQL Server Analysis Services (SSAS) is an analytical engine that provides data for reporting and visualization tools. A semantic data model can be authored in either the Tabular or Multidimensional formats. This model consists of tables, relationships between those tables, hierarchies, attributes derived from the dimension tables and measures and calculations derived from the fact tables. With the model published in a centralized database, it can be leveraged and explored via a variety of front end tools, such as Excel, Power BI, SSRS, and PerformancePoint.
SharePoint
SharePoint is a web application platform that serves many purposes, including intranet, content management, search, workflow management and business intelligence. From a reporting perspective, SharePoint often serves as an organization’s main portal for various Microsoft BI technologies, such as SSRS, SSAS and PerformancePoint.
PerformancePoint
PerformancePoint is a performance management service within SharePoint that is used to create interactive dashboards. It allows users to present various elements in a unified framework, tying together SSRS reports, Visio diagrams, SSAS-based graphs, maps, scorecards, decomposition trees and so on. KPIs and stoplighting can be defined for any measure and then presented in scorecards. Although PerformancePoint is included in SharePoint 2016, it is an older tool, and new features will not be added.
View our on-demand webinar Choosing the Right Microsoft BI Tool for the Job to learn even more about each tool’s strengths and weaknesses, understand when it’s better to use one tool rather than another, and how they integrate together to form a complete BI framework.


